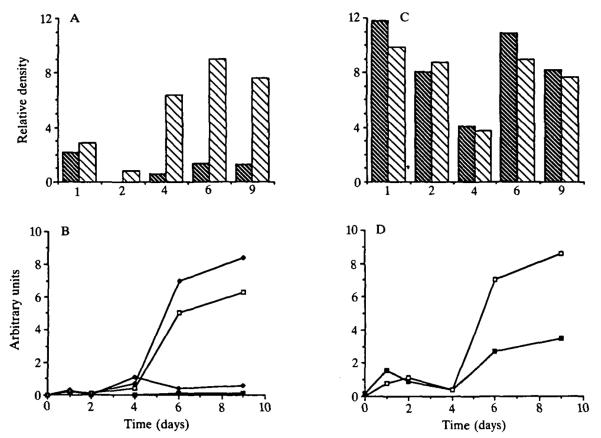
Fig. 8.
Time course of milk protein secretion into the medium and the EGTA-sensitive compartments by cells cultured on EHS matrix. (A) Proportion of β-casein in the medium (black bars) and lumina (open bars). The areas of the bands of interest were integrated by scanning densitometry and are expressed in arbitrary units; similar determinations for α-casein produced a comparable pattern (not shown). (B) Relative amounts of secreted α (squares) and β-casein (diamonds) in the medium (closed symbols) and lumina (open symbols) were determined by correcting the relative density of protein bands shown in A for total secretion and normalizing for DNA content. (C) Proportion of transferrin in the medium (black bars) and lumina (open bars) determined as in A. (D) Total amount of transferrin in the medium (closed symbols) and lumina (open symbols) determined as in B. These data were from the same experiment as represented in Fig. 7B.

