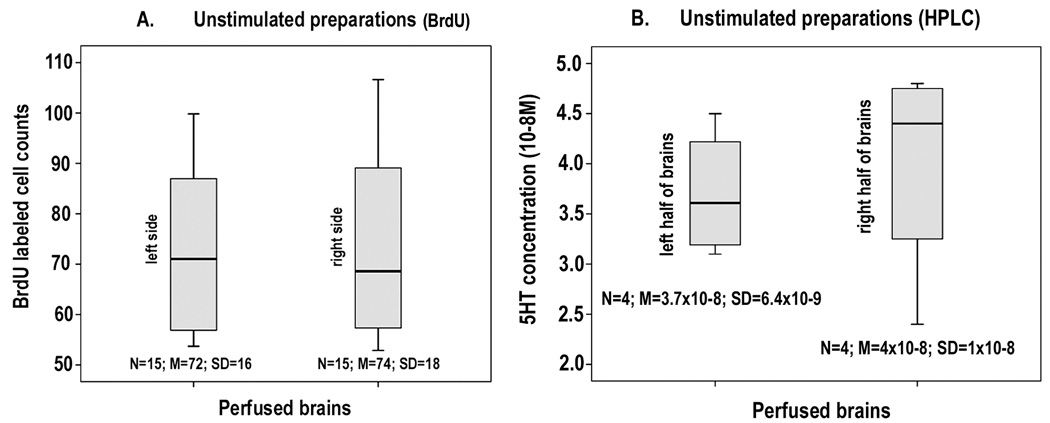
Figure 4.
Figure 4A: Comparison of the BrdU-labeled cell counts from the left (first column) and right (second column) CL10 of unstimulated, perfused brains. No significant difference was found between the numbers of BrdU-labeled cells on either side of the brains. (Paired samples T test: p = 0.685). 4B: Levels of serotonin contained in the left (first column) and right (second column) halves of unstimulated, C. destructor brains following 6 hours of perfusion. HPLC analysis revealed no significant difference between the two sides (Paired samples T test: p = 0.463)

