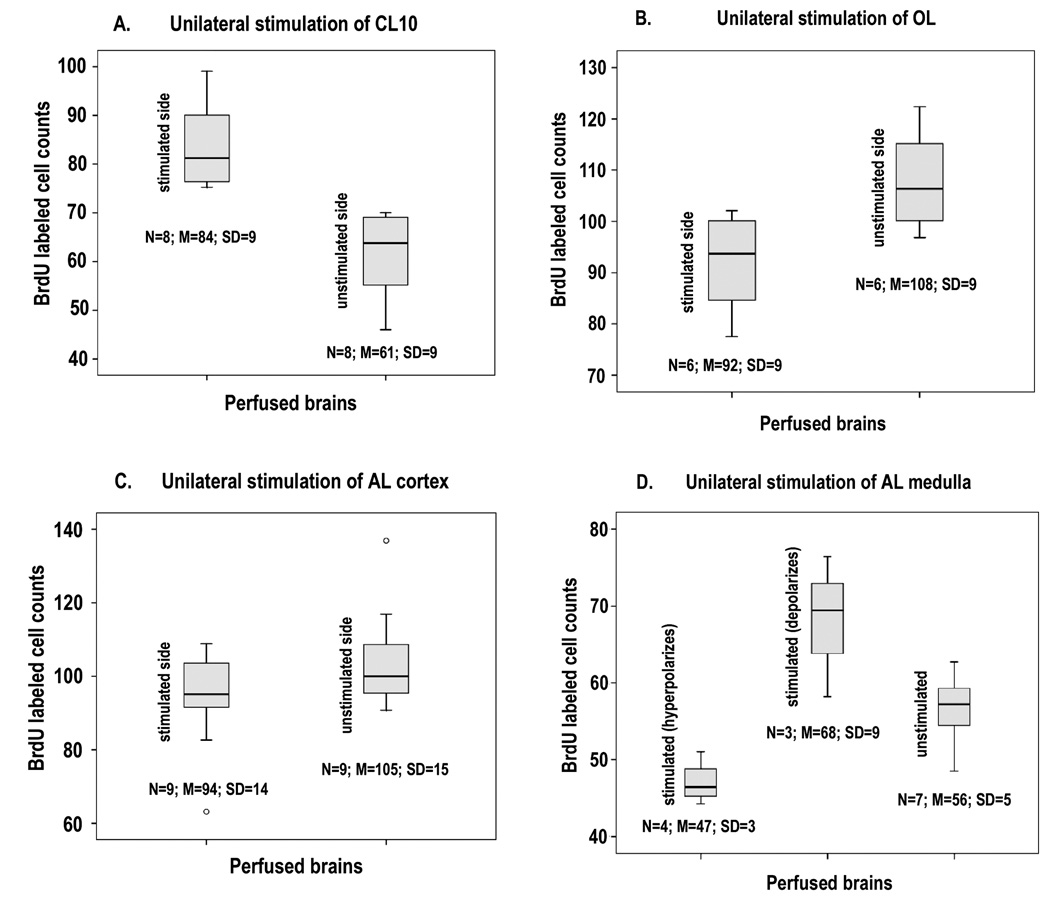
Figure 6.
Comparison of the counts of BrdU labeled cells in CL10 on the stimulated and unstimulated sides of brains in which stimulation was applied unilaterally to different areas of the brain. 6A: CL10. More cells were labeled on the stimulated side. (Paired samples T test: p = 0.008). 6B: OL. Fewer labeled cells were found on the stimulated side, but this difference was not statistically significant (Paired samples T test: p = 0.093). 6C: AL (cortex). No significant difference was observed between labeled cell counts on the two sides of the brain. (Paired samples T test; p = 0.271). 6D: AL (medulla). The results from the stimulated side are separated into preparations in which the DGN was hyperpolarized (first column) those in which it was depolarized (second column), and the unstimulated side (third column). Significant differences exist between the groups (ANOVA: p = 0.001) and within the groups (Tukey: hyperpolarized - depolarized, p = 0.001; hyperpolarized – unstimulated, p = 0.043; depolarized - unstimulated, p = 0.027)

