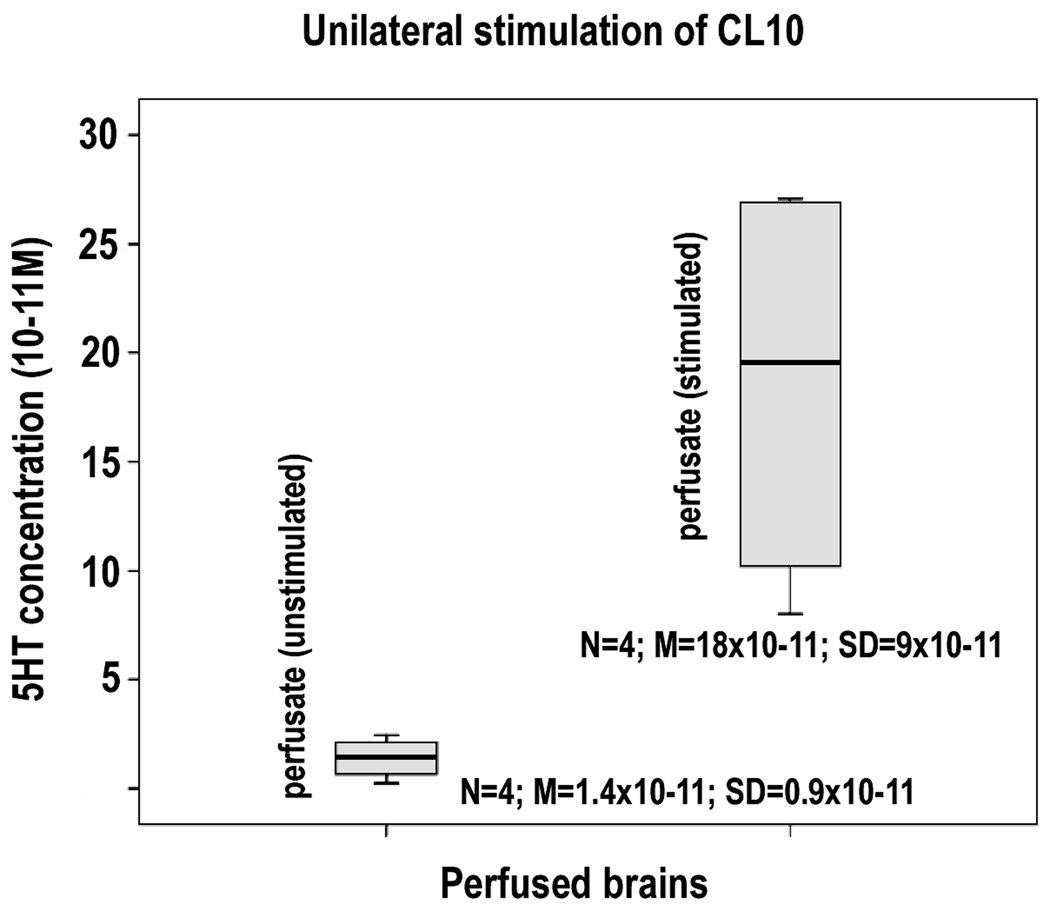
Figure 7.
Comparison between the levels of 5HT collected in the perfusate over 4 cycles from the crayfish brain during periods of no stimulation (first column), and stimulation (second column), of the CL10 cell bodies, measured by HPLC. 5HT levels in samples taken over 10-minute periods preceding the stimulation of CL10 are about ten times less than levels in samples taken over 10 minute periods during stimulation. (Independent samples T test: p < 0.013).

