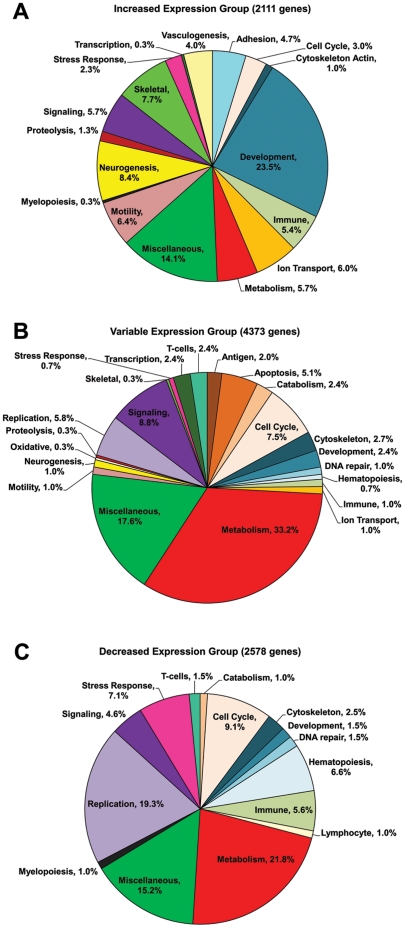
Figure 4. Percentage distribution of significant Gene Ontology/Biological Processes associated with each major group of clustered gene expression profiles.
DAVID EASE (version 2.0) software was used to analyze the gene lists for each major temporal group (increased, variable, and decreased expression) to find all categories associated with the Biological Processes domain of the Gene Ontology (GO) consortium, using a significance threshold of p<0.05. Individual gene ontology results with related or overlapping functions were manually combined into overall major categories. Each biological process category is assigned a distinct color, and consistent colors were used for comparisons of the same biological process category found for more than one of the three major groups of clustered gene expression profiles/each of the three pie graphs, which include Increased Expression Group shown in Figure 4A , Variable Expression Group shown in Figure 4B , and Decreased Expression Group shown in Figure 4C . For example, the major category of “metabolism” is consistently assigned the color red. The number of genes within each of the three major temporal groups (increased, variable, and decreased expression) that underwent gene ontology/biological process analysis is denoted in the title of each pie graph.

