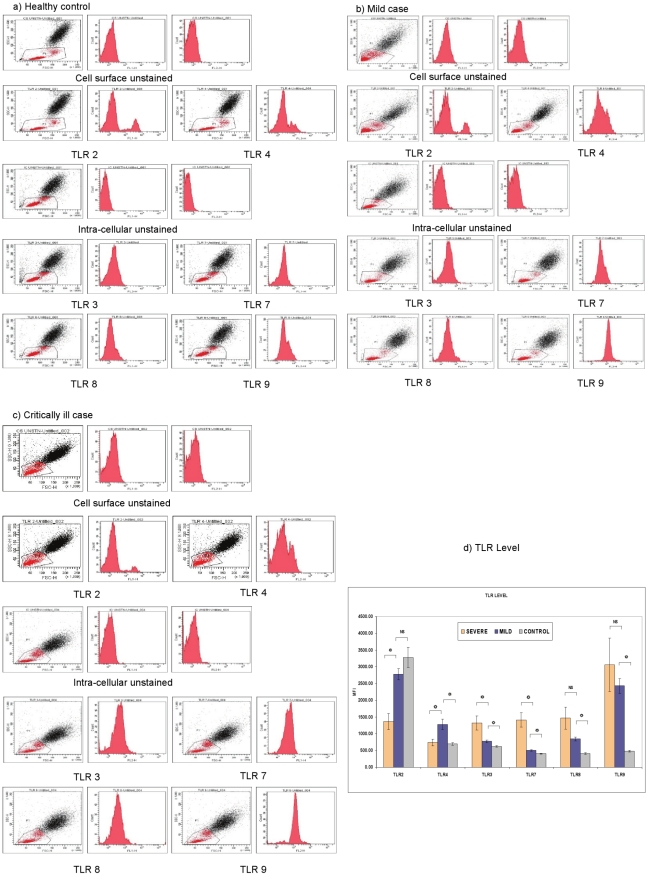
Figure 2. TLR levels in the blood lymphocytes and monocytes.
TLR levels of peripheral blood from the patients and healthy controls were determined separately by either surface staining or intracellular staining of the cells using TLR specific antibodies followed by FACS analysis. Scatter dot plots and histograms: A representative sample each from different categories, a) healthy individual, b) mild case, c) critically ill case, d) TLR levels: Expressed as median fluorescence intensities (MFI) for different categories of patients.

