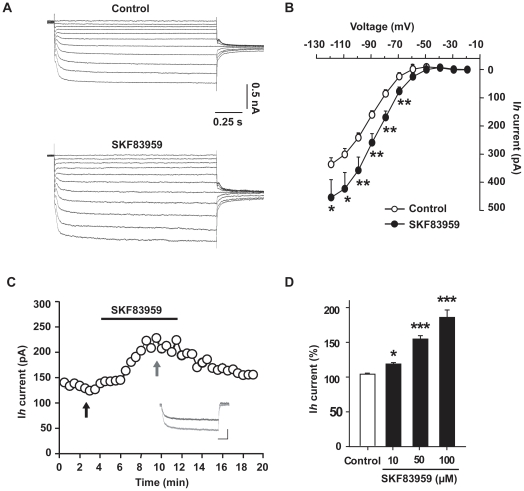
Figure 3. SKF83959 increased Ih current in hippocampal CA1 pyramidal neurons.
A. Current family of Ih recorded from a representative neuron in the presence and absence of SKF83959 (50 µM). The neuron was hold at −20 mV and current traces were elicited with a series of 1.5-s hyperpolarizing voltage steps from −20 mV to −120 mV with increment of 10 mV followed by a voltage step to −80 mV to measure the tail currents. B. Averaged current/voltage (I/V) relationship of Ih plotted in the presence and absence of SKF83959 (50 µM). C. Plot of the amplitude of Ih against time in a representative neuron. The black bar denotes the perfusion with SKF83959 (50 µM). The neuron was hold at −45 mV, and Ih was elicited with 1.5-s hyperpolarizing voltage steps to −105 mV every 30 sec. The inset shows the superimposed current traces taken at the time indicated by the two arrows. Scale bars: 0.5 s, 250 pA. D. Bar graphs showing the maximal steady-state amplitude of Ih in the presence of different concentrations of SKF83959. *P<0.05, **P<0.01, ***P<0.001 vs. Control.

