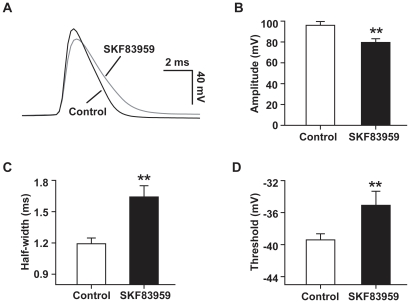
Figure 7. Effect of SKF83959 on action potentials of CA1 pyramidal neurons in hippocampal slices.
A. Superimposed action potentials elicited in a representative neuron prior to and after perfusion with SKF83959 (50 µM). For comparison, the membrane potential was compensated. B. Bar graph showing the amplitude of action potentials prior to and after perfusion with SKF83959 (50 µM). The amplitude was defined as the voltage difference between the threshold and peak of the action potential. C. Bar graph showing the half-width of action potentials prior to and after perfusion with SKF83959. The half-width was measured as the width of half-maximal spike amplitude. D. Bar graph showing the threshold of action potentials prior to and after perfusion with SKF83959 (50 µM). The threshold was defined as the first point on the upstroke of action potential with a rising rate exceeded 50 mV/ms. In B, C, D, n = 8, **P<0.01 vs. Control.

