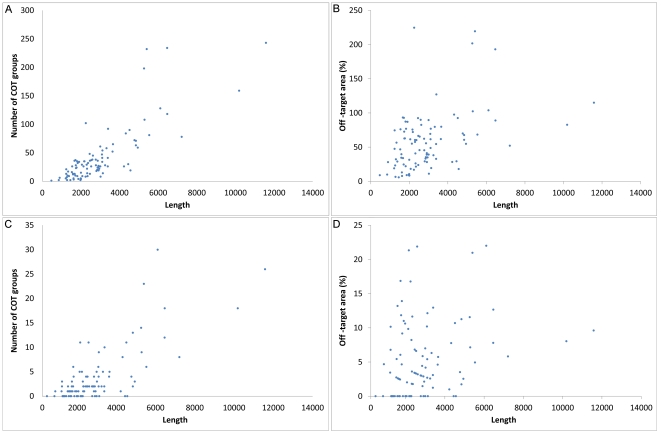
Figure 4. The number of cot-groups correlate with the length of the cDNA.
As expected, the length of the gene correlates with the number of cot-groups that can be formed (Spearman's correlation coefficient of 0.44; P < 0.001). This is because the number of potential siRNAs that may originate from one cDNA sequence increases proportionately with the length of the gene. Each potential siRNA adds up on the possibility to form a cot-group. A: The number of cot-groups against the length of the gene is plotted. B: The percentage of the sequence within the analyzed genes that map to common off-targets is shown. These values were acquired by multiplying the members of the different cot-groups with the length of a single siRNA (21-bp) within every gene and this is divided by the whole gene length. These values become less reliable with large genes, because there is an increased chance of a single siRNA being part of multiple cot-groups. In that case the area may reach beyond the 100%. C-D: An identical analysis as described under A and B was performed but now only off-targets were considered targeting mature RNA sequences .

