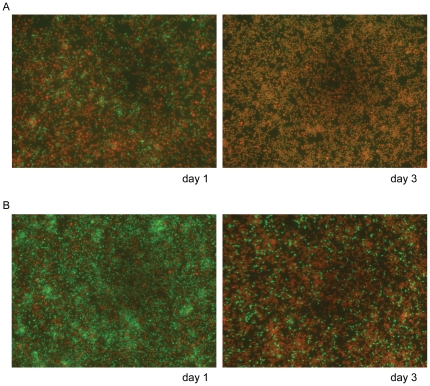
Figure 7. Fluorescence microscopy analysis of A. actinomycetemcomitans in the transwell system.
A) A. actinomycetemcomitans mono-species culture in CDM/sucrose at days 1/3. B) A. actinomycetemcomitans grown in the remote presence of S. mitis on days 1/3. For the assay the cells were stained with the Live/Dead dyes. Live cells are stained in green, dead cells light up in red. Magnification: 400× for every picture.

