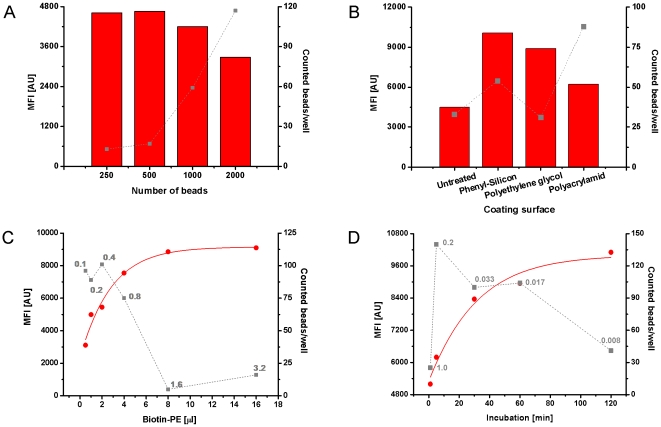
Figure 2. Optimization of µFBI-relevant parameters.
(A – D) denote the optimization of bead number, capillary coating surface, analyte volume, and incubation time, respectively. In the experiment, anti-biotin antibody-coated beads were incubated in the capillary with biotin-PE (100 ng/ml). The resulting beads were then pumped out and diluted in 100 µL with assay diluent and analyzed with the Luminex 100 IS system using fluorescent detection. The numbers in gray given in C and D represent the flow rate of the sample solution. The MFI value (column for A and B, circle for C and D) was read out and the recovered beads (square) were counted with the Luminex 100 IS system.

