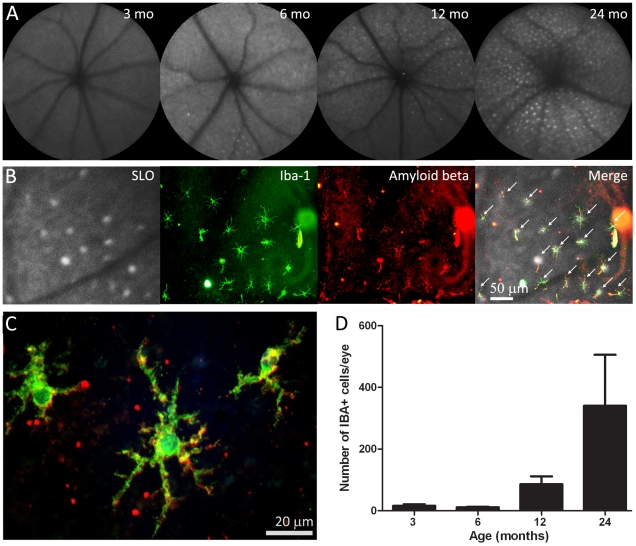
Figure 1. Retinal imaging and macrophage histology.
A. Scanning laser ophthalmoscope images of the retinae of mice taken at 3, 6, 12 and 24 months of age. With time there is an accumulation of fluorescent point sources. B. The images are overlaid with the eyecups of a 12 months old mouse once they have been stained for Iba-1 to reveal macrophages and Aβ. This shows that many of the point sources are macrophages containing Aβ (indicated with arrows). These are arranged in a grid like pattern. C. A higher power image of Aβ containing macrophages of a 12 months old mouse. D. The number of macrophages present in the whole mounts at progressive ages. There are significant increases at 12 and 24 months (see text for statistics).

