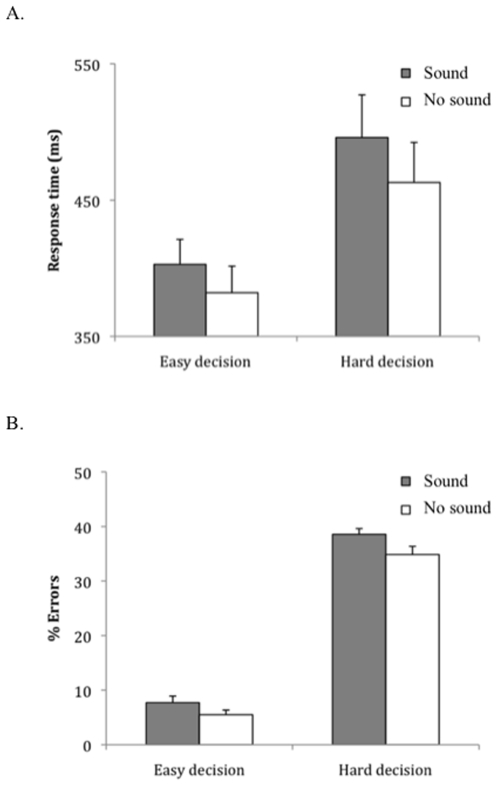
Figure 1. Response times and errors to easy- and hard-shot decisions when sound was or was not present.
Dark grey bars represent when the sound was present and clear bars when the sound was absent for easy- and hard-shot decisions (A – response time and standard error bars in ms; B – total percentage and standard error bars of decision errors). All differences are significant.

