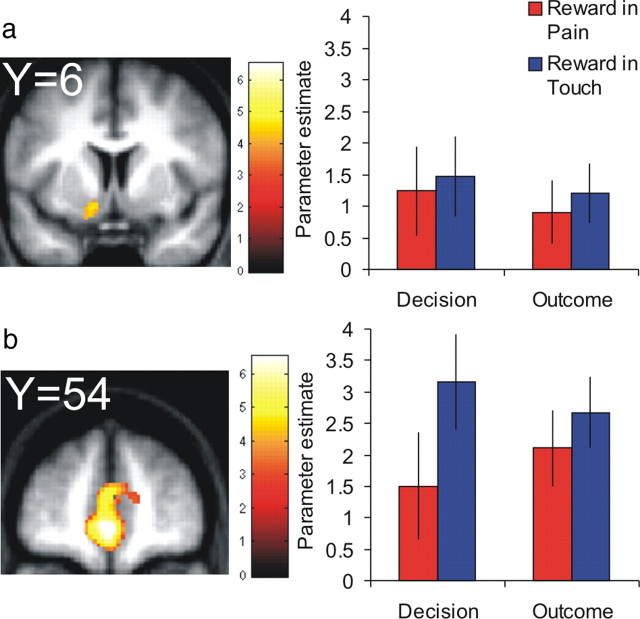
Figure 3.
Representation of reward. Reward prediction errors activated ventral striatum (a) and ventromedial prefrontal cortex extending to anterior cingulate cortex (b). Group-level β parameter estimate plots to the right of each activation map show that these regions expressed reward prediction errors positively across trial type (pain and touch) and time point (decision and outcome). Error bars represent SE.

