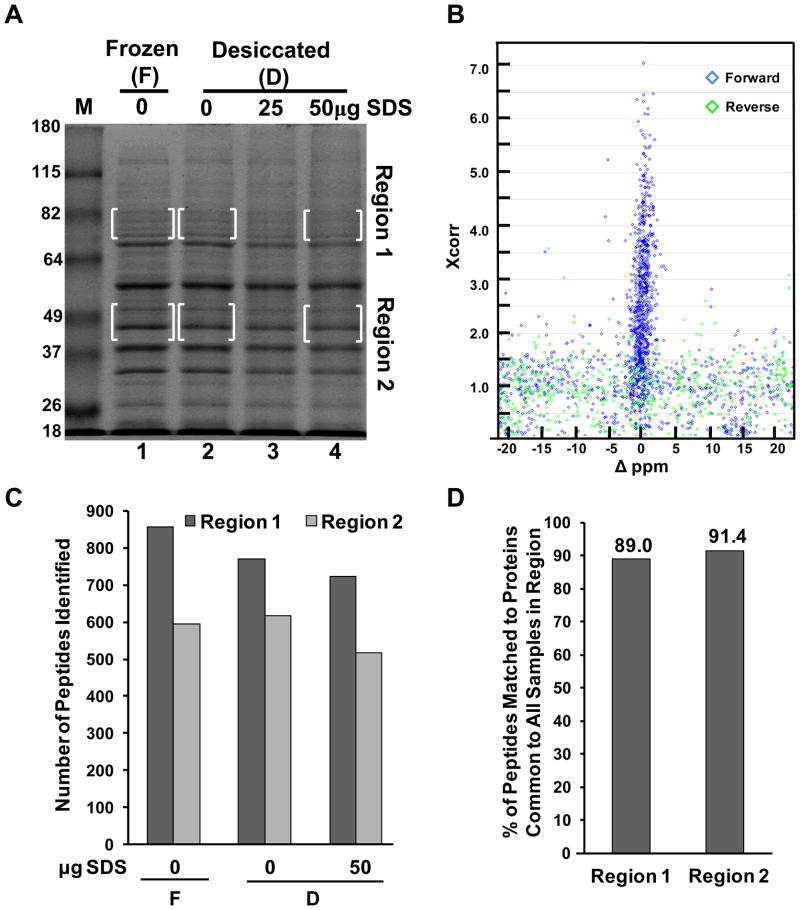
Figure 1.
Desiccation methods for protein preservation of a complex cell extract for MS-based identification. (A) SDS-PAGE and analysis of HEK 293 hypotonic whole cell extract preserved by freezing or desiccated in the presence and absence of SDS as indicated. Bracketed areas indicate gel regions subjected to further analysis via LC-MS/MS. Molecular weight markers in lane “M” are in kilodaltons. The gel was stained with Coomasie. (B) Scatter plot of SEQUEST Xcorr scores vs. Δppm values for each top peptide assignment matching to the forward (blue), or reverse (green) human IPI protein database. Scatter plot is for only one of the six regions analyzed and represents visually (along with Supporting Information Figure 1) the establishment of criteria to filter the data to a less than 0.01% false discovery rate. (C) Summary of the number of peptides identified in each boxed region from Figure 1A. (D) Percent of peptides matching to proteins identified in all three samples for a given region.

