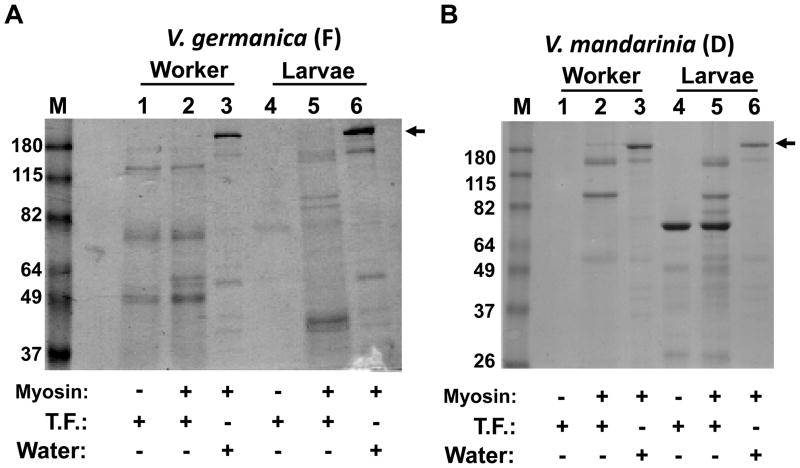
Figure 3.
SDS-PAGE analysis of myosin proteolytic activity assays performed on samples collected in the field. (A) Trophallactic fluid (T.F.) from V. germanica collected in Vermont, frozen (F) on dry ice, then stored at −80°C prior to myosin activity assay and SDS-PAGE. (B) V. mandarinia trophallactic fluid collected in Japan, and stored desiccated (D) until subjected to the myosin activity assay and SDS-PAGE. Arrow heads indicate full length myosin. Molecular weight markers in lane “M” are in kilodaltons. The gel was stained with Coomassie.

