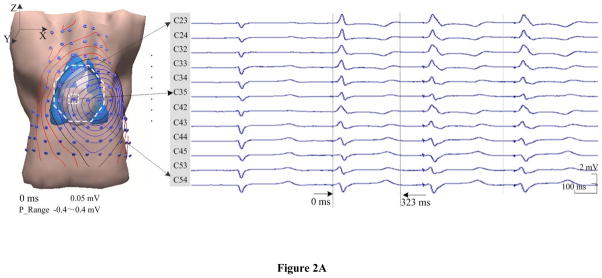
Figure 2.
Results in an animal for pacing at the site of LVL. A. Torso model with illustration of body surface electrode positions, and selected ECG waveforms within the area marked by the white dotted line on the anterior chest. B. Results during ventricular depolarization following pacing (from 17 ms after pacing spike). In subfigures B: (i) Body surface isopotential contour maps and (ii) Estimated dipole trajectory of the cardiac activation. Each isopotential map is depicted at a different time instant by the increment of 0.05 mV. In the dipole trajectory, dark blue represents the earliest activated dipole marked by ‘IS’ and red represents the latest activated one. The green ball represents the position of pacing stimulus marked by ‘PS’. The axis of X, Y, and Z is consistent with that of torso model, which are in terms of the right-left, the posterior-anterior, and the inferior-superior, respectively.


