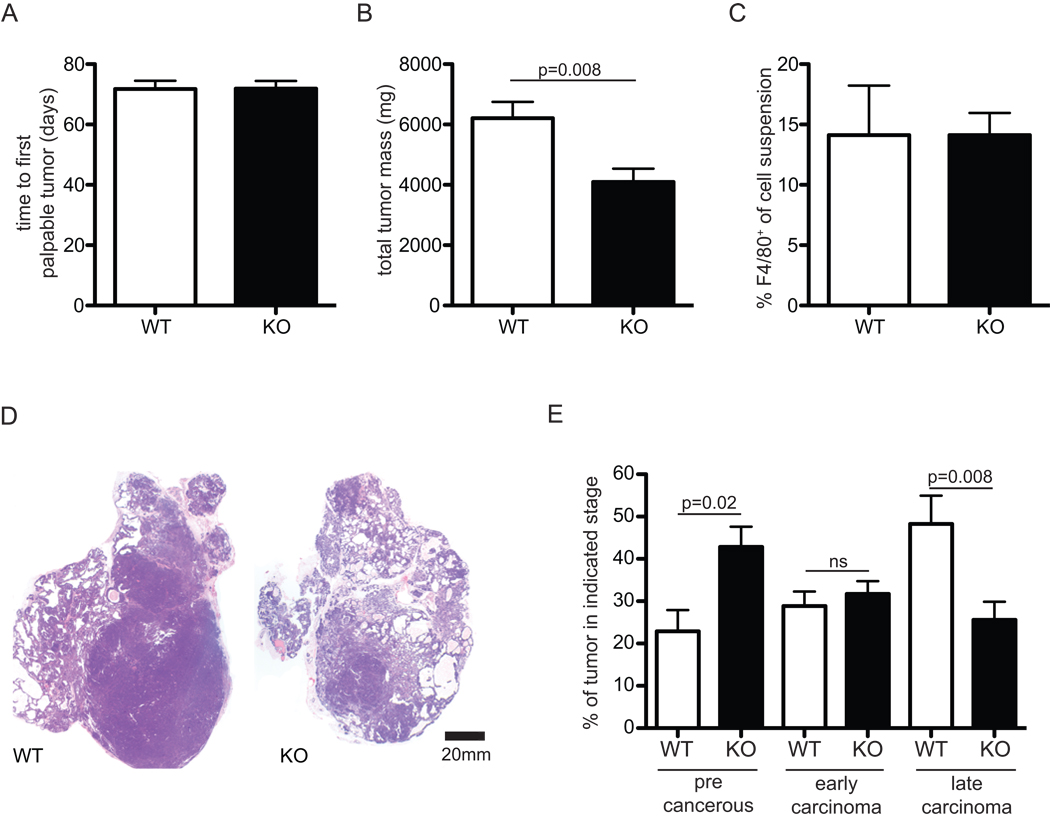
Figure 1. Deletion of HIF-1α in macrophages results in lower endpoint tumor mass despite equivalent latency and macrophage infiltration.
(A) latency, or time to first tumor (B) mass of all tumors at 20-week endpoint, n=8 (C) % of F4/80+ macrophages in single cell suspensions generated from tumors, n=4 (D) macroscopic hematoxylyn and eosin staining of typical tumors (E) histological stage analysis of tumors. All error bars are S.E.M.

