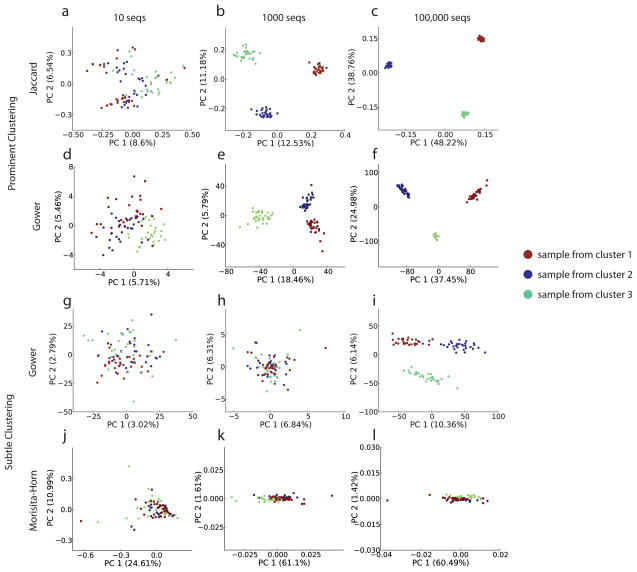
Figure 4.
Deep sequencing is superfluous when clusters are prominent, but critical when clusters are subtle. Data representing either prominent or subtle clusters was generated (see methods) with varying sequencing depths. (a–c) Jaccard distance followed by PCoA was applied to prominent cluster data with 10, 1,000, or 100,000 sequences per sample. No substantial improvement in the effectiveness of the method was found above 1,000 sequences per sample. (d–f) Gower distance followed by PCoA was applied to the same data (g–i) Gower distance applied to more subtle clusters.. (j–l) Morisita-Horn distance followed by PCoA applied to the subtle clusters. Although substantially more of the variance is explained by this method, the clusters are not easily interpretable: this situation persists even with 10 million sequences per sample (data not shown).

