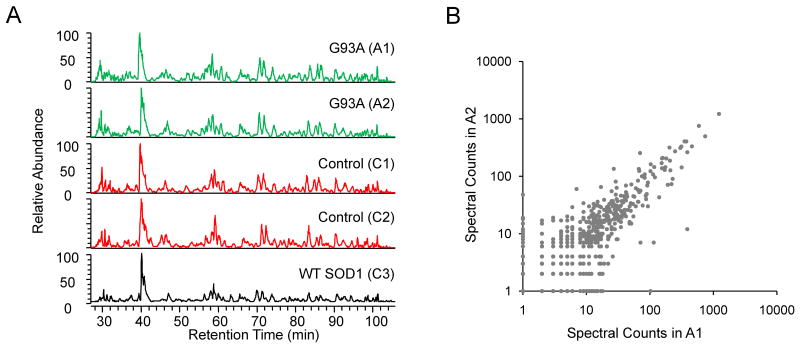
Figure 2.
Evaluation of experimental variations in the proteomics analysis.
(A) Comparable elution profiles of five digested peptide samples indicate consistent LC-MS/MS runs. The five samples were produced from one set of five gel bands, representing the five sample lysates, respectively.
(B) Comparison of the spectral count results of two biological replicates (ALS mouse samples: A1 and A2).

