
Figure 5.
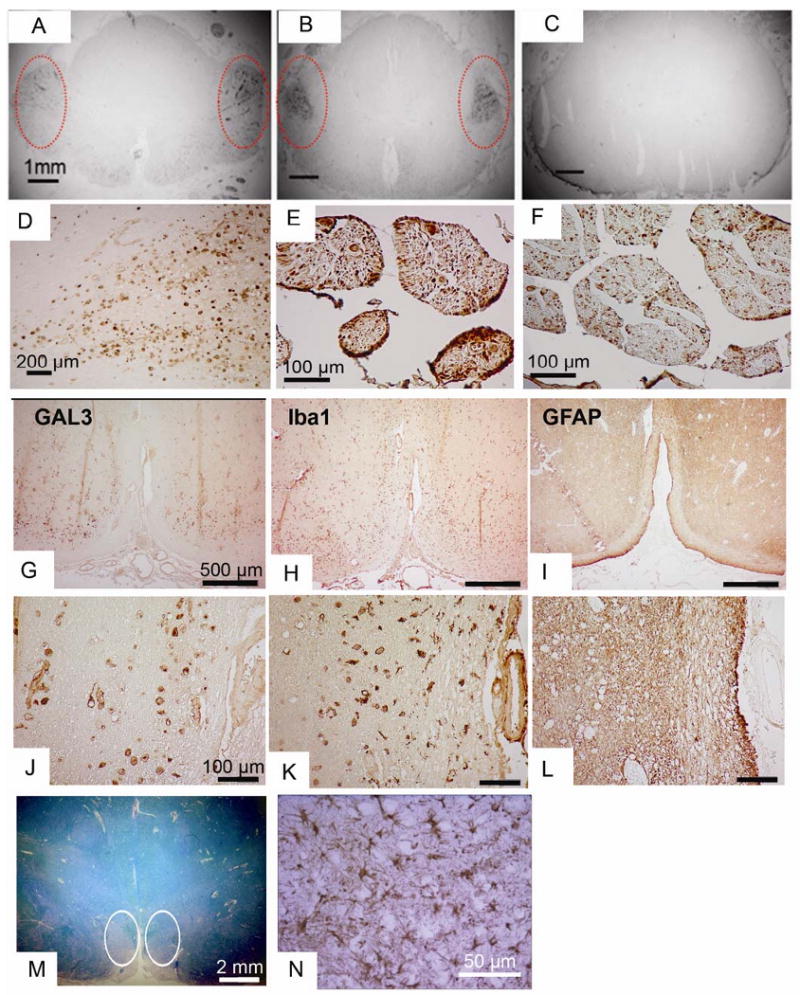
ICC analysis of Gal3 in human ALS tissues.
(A-C) Gal3 ICC in spinal cord sections from ALS (A and B) and Alzheimer Disease (C). Note the intense staining in the regions of the corticospinal tracts in the ALS cases (circled)
(D) Higher power of the region of corticospinal tracts.
(E-F) In the same ALS patient, Gal3 staining is more prominent in the ventral (E) vs. the dorsal (F) root.
(G-N) Serial sections from the ventral medulla from an ALS patient stained for Gal3, GFAP, and Iba1 in the region of the pyramidal tracts, at low power (G, H, I) and high power (J, K, L). The pallor seen on luxol fast blue (M, circled) indicates the ongoing axonal degeneration. The macrophage marker Iba1 shows prominent staining in similar pattern to Gal3, but the astrocyte marker GFAP shows little staining in this region. Serving as an internal control for GFAP staining is another region of the same tissue section showing the presence of reactive astrocytes (N).