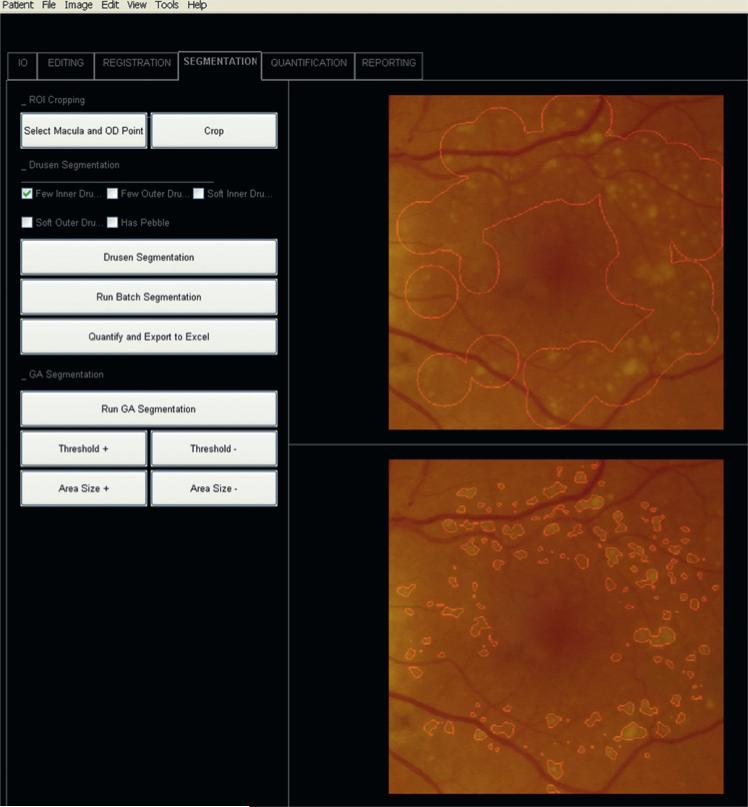
Figure 3.
Screen shot from Graphical User Interface (GUI). Patient 3 left eye (OS). Final image from figure 1 cropped for analysis to the 6000 μm region by the two-click autocrop tool (buttons upper left) in register with the initial image. Above: user selected area of drusen. Below: drusen segmentation.

