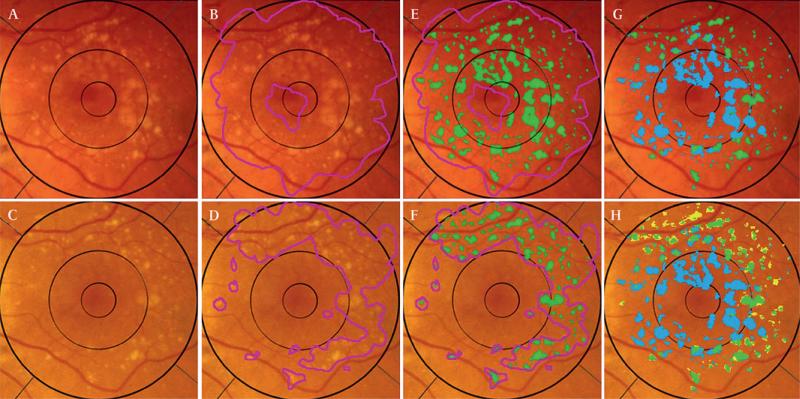
Figure 4.
User interactive drusen segmentation of serial images and dynamic classification. Registered images from figure 1 cropped for analysis to the 6000 μm region. Top row, initial image; bottom row, final image. (A) Initial image, original. (B) Initial image, user selected area of drusen (magenta). Note that bright area of peripapillary atrophy/hypopigmentation is excluded. (C) Final image, original. (D) Final image, user-selected area of drusen. (E) Initial image, drusen segmentation (14.83%, green) obtained by mathematical model applied to user-defined region. (F) Final image, drusen segmentation (7.74%, green). (G) By comparison of initial to the final segmentation, the initial drusen segmentation is subdivided into stable (4.31%, green) and resorbed (10. 51%, blue). (H) Final drusen segmentation, subdivided into stable (4.31%, green) and new (3.43%, yellow), with resorbed (10.51%, blue) overlaid.

