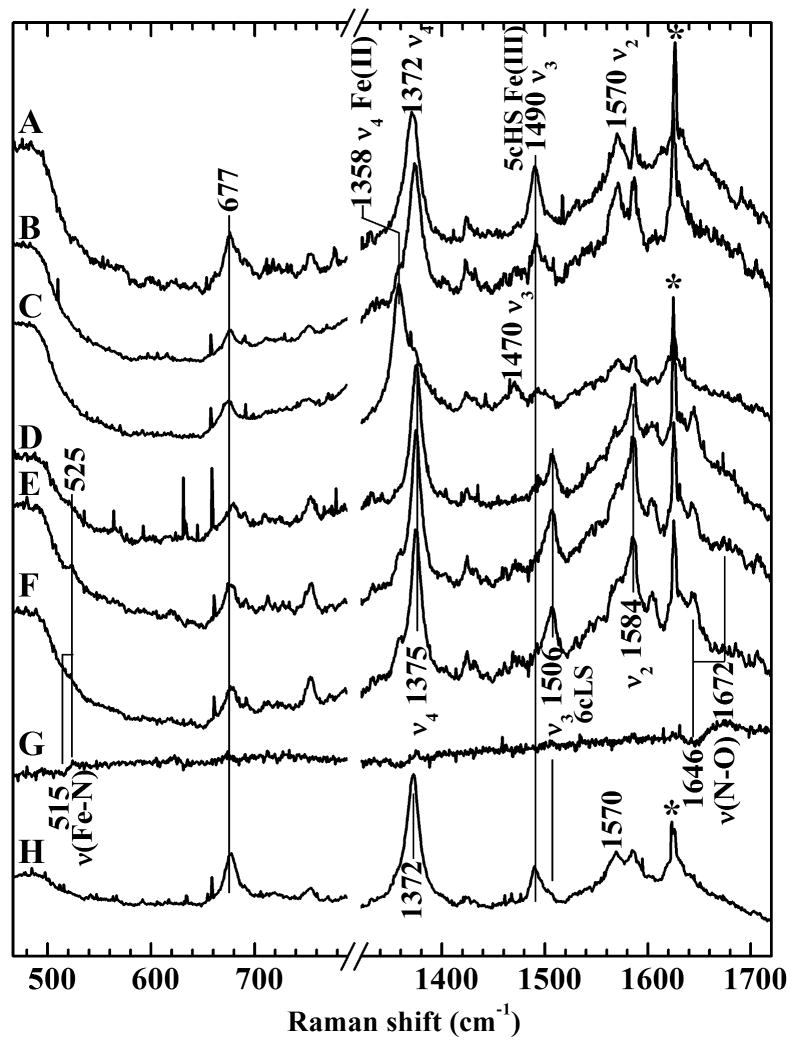
Figure 4. Resonance Raman spectra of hemozoin in food vacuoles isolated from P. falciparum.
All spectra were recorded with 406.7-nm excitation wavelength. A: spectrum of isolated food vacuoles, B: spectrum of anaerobic food vacuoles treated with 5 mM Na14NO2, C: spectrum of anaerobic food vacuoles treated with 2 mM Na2S2O4, D: spectrum of anaerobic food vacuoles under 1 atmosphere NO, E: spectrum of anaerobic food vacuoles treated with Na14NO2 and Na2S2O4, F: spectrum of anaerobic food vacuoles treated with Na15NO2 and Na2S2O4, G: difference spectrum obtained by digital subtraction of spectrum F from spectrum E, H: Sample from E opened to air. The sigmoidal difference features in trace G show the shifts of νFe–N and νN–O to lower frequencies in the spectrum of the 15NO isotopologue. The sharp lines marked with asterisks are due to Rayleigh scattering of plasma emission lines from the Kr + laser.

