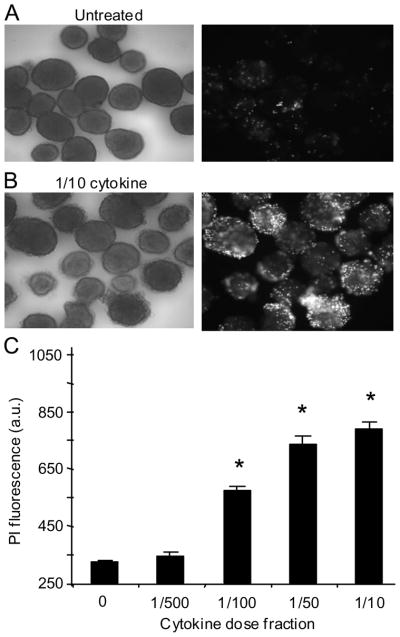
FIGURE 1.
Cytokine-induced islet cell death. A–B, Bright field image of control untreated islets (A, left panel) and corresponding PI fluorescence (A, right panel) compared with an image of islets treated overnight with 1/10 fractional dose of cytokines (B, left panel) and corresponding PI fluorescence (B, right panel). C, Islet PI fluorescence in response to a graded increase in cytokine concentrations. Each bar represents an average of 30–45 islets. Note that the pixel intensity of the background in this recording system was ~260 arbitrary units (a.u.). * indicates P < 0.001.

