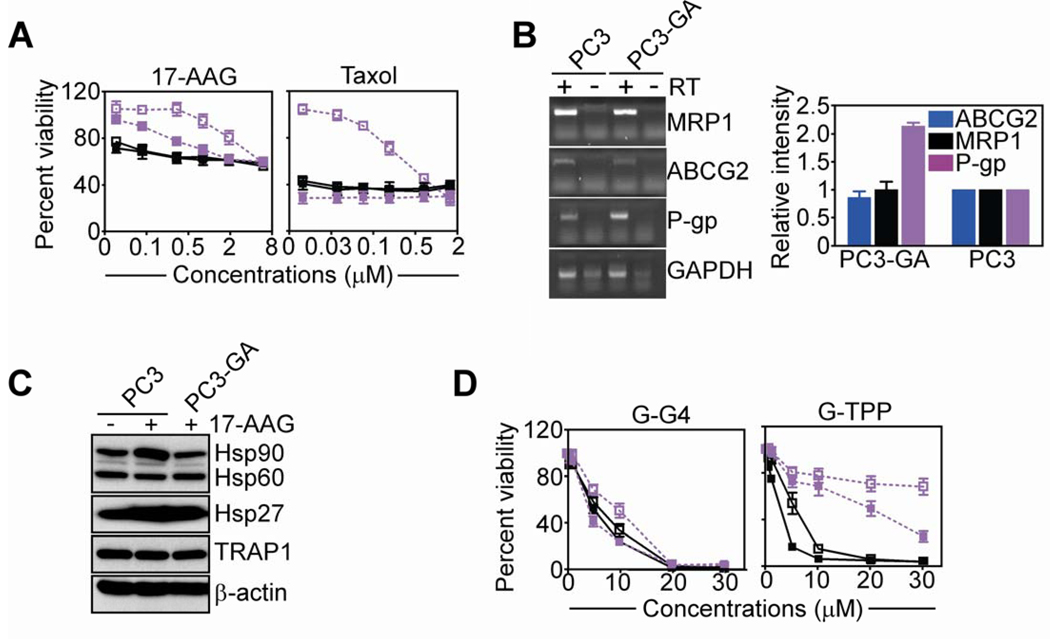
Figure 3. Activity of Gamitrinib against multidrug-resistant prostate cancer.
A, PC3 (black) or PC3-GA (purple) cells were treated with the indicated concentrations of 17-AAG (left) or taxol (right), and analyzed by MTT in the presence (solid symbols) or absence (open symbols) of verapamil (20 µM). B, PC3 or PC3-GA cells were analyzed by PCR, and amplified bands were visualized by ethidium bromide staining (left), and quantified (right). RT, reverse transcriptase. C, PC3 or PC3-GA cells were analyzed by Western blotting before or after treatment with 17-AAG. D, The experimental conditions are as in A, except that PC3 or PC3-GA cells were treated with G-G4 (left) or G-TPP (right) and analyzed by MTT. For panels, A, B and D, mean±SEM of replicates.

