
Figure 3.
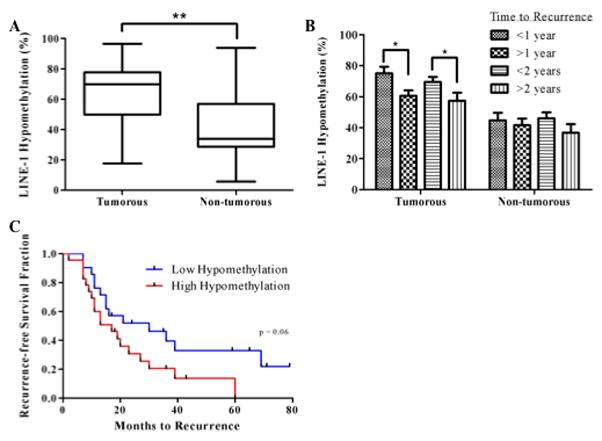
Analysis of LINE-1 hypomethylation levels in tumorous and non-tumorous tissues. (A), box plot of average LINE-1 hypomethylation level according to tissue type. Medians, interquartile ranges, minima and maxima are shown. **p<0.001, two-tailed, paired t-test. (B), Differences in LINE-1 hypomethylation levels according to early or late recurrence. Means + SEM are shown. *p<0.05, two-tailed, unpaired t-test. (C), Kaplan-Meier recurrence-free survival curve and Log-Rank (Mantel-Cox) test of time to recurrence according to high (above median) or low (below median) hypomethylation levels in non-tumorous tissues.