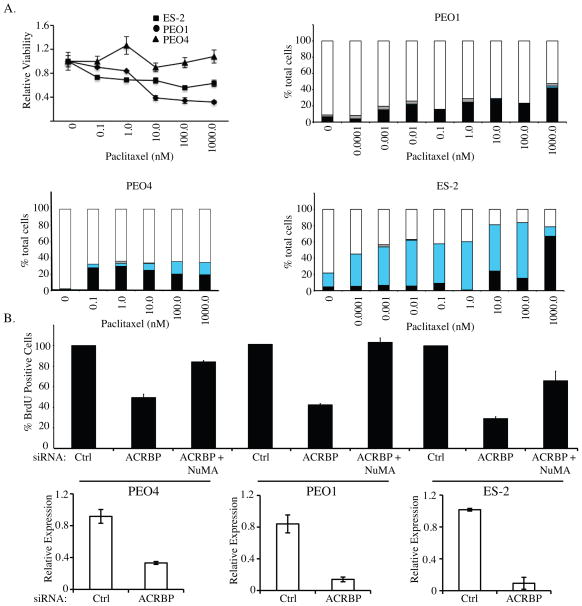
Figure 5. ACRBP depletion inhibits DNA Synthesis.
A) Line graph is paclitaxel dose-response curves generated for three ovarian cancer cell lines as indicated. Bar graphs are relative viability following a 48 hour exposure to the indicated paclitaxel concentrations in three different ovarian cell lines. Bars represent S.D. from triplicate analyses. Cells were immunostained for chromosomes, microtubules and centrosomes, and scored for the percentage of interphase cells (white bars), mitotic figures (black bars), micronucleated cells (Cyan bars), and apoptotic bodies (grey bars). Over 100 cells were counted for each condition, and means are shown from 2 independent experiments. B) The indicated ovarian cancer cell lines were transfected with the indicated siRNAs. 72 hours post-transfection, BrdU was added to the culture medium for 14 hours. BrdU incorporation was detected with an anti-BrdU antibody, nuclei were counterstained with DAPI and the percentage of BrdU-positive cells was quantified by microscopic observation. At least 100 cells were analyzed for each condition for each experiment across a minimum of 3 different fields of view. Values are normalized to the BrdU-incorporation frequency observed in control-transfected cells, which was set to 100%. Error bars indicate S.D. of 2 independent experiments each with 2 replicates. Quantitative rtPCR was performed on parallel samples to validate knockdown of ACRBP (bottom panels).

