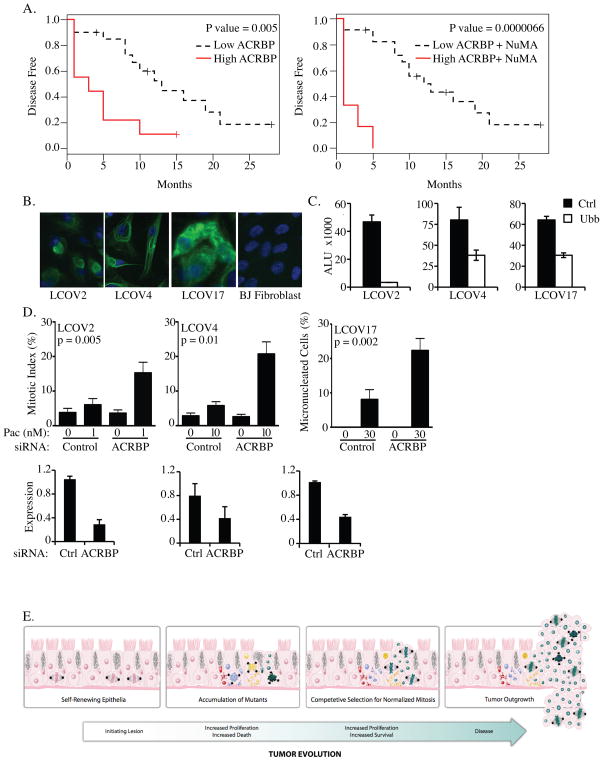
Figure 6. ACRBP correlates with aggressive disease and paclitaxel resistance in tumor explants.
A) Kaplan-Meier plots of disease-free survival association with ACRBP expression (left) or ACRBP and NuMA expression (right). B) Primary tumor cultures derived from patient samples were immunostained with cytokeratin-16 (green) and DAPI (blue). C) siRNA transfection efficiency was monitored by measuring viability following transfection of siRNAs targeting an essential gene product, UBB. ALU: Arbitrary Light Units (right panels) D) Primary tumor cultures were transfected with indicated siRNAs for 48 hours then exposed to the indicated paclitaxel concentrations for 24 hours. For LCOV2 and LCOV4, paclitaxel doses were chosen as those which were at least 10-fold below that required to significantly increase the mitotic index of the parental cultures. For LCOV17, 30 nM was the lowest dose at which any defect, in control or ACRBP transfected cells, was detected. Following immunostaining with anti-β-tubulin and DAPI, mitotic figures were scored microscopically and are expressed as the % of total cells counted. A minimum of 200 cells were counted for each condition in each of 2 independent experiments. Error bars represent standard error from the mean from multiple, different fields of view. Quantitative rtPCR was performed to validate ACRBP mRNA depletion. E) Cartoon representation of epithelial tumor evolution indicating the selection bottleneck that can promote acquisition of anomalous components that normalize mitotic dysfunction and thus support clonal expansion.

