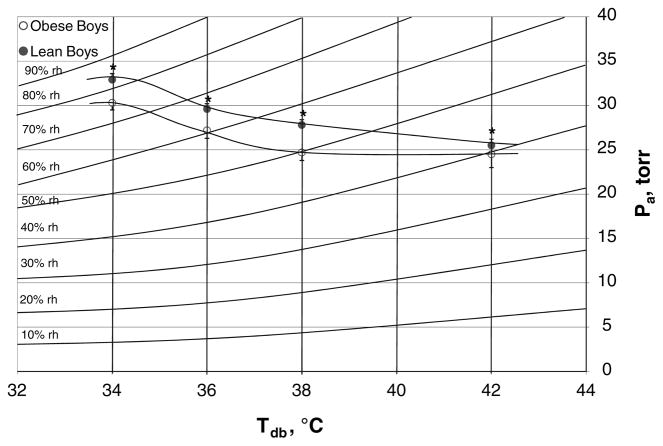
Fig. 2.
Critical environmental limits on a standard psychrometric chart. Values are means ± SE for 7 lean and 7 obese subjects at 34, 36 and 38°C and 7 lean and 5 obese subjects at 42°C. Compared to lean subjects, obese subjects consistently had significantly lower critical water vapor pressure (Pcrit) values in each warm environment. *Significant group difference at P < 0.03

