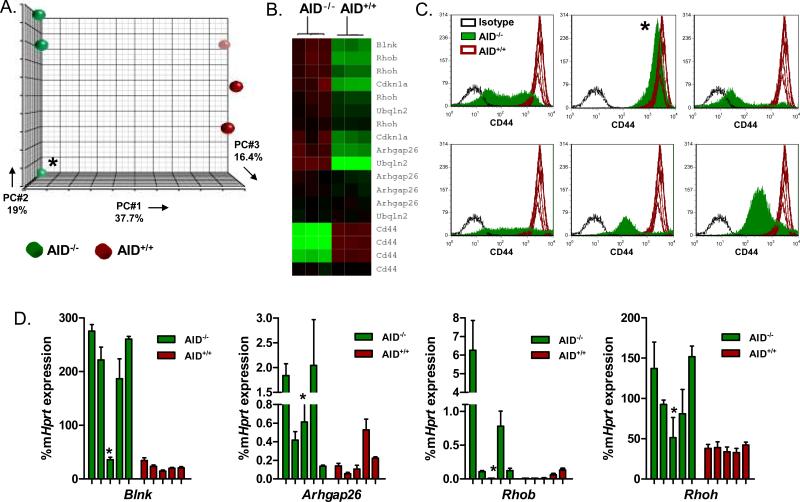
Figure 3. Differential gene expression patterns in AID-/- and AID+/+ leukemia.
A. Principle component analysis. RNA was extracted from leukemia cells harvested from 6 mice; 3 mice with AID-/- leukemia and 3 mice with AID+/+ leukemia. The AID-/- outlier is designated by an asterisk in subsequent figures. Samples were hybridized to Affymetrix mouse genome 430A 2.0 arrays. 2,365 genes were found to be significantly differentially expressed (FDR 0.05, p<0.0026). B. Heatmap of genes chosen for validation by quantitative RT-PCR. C. CD44 expression in AID+/+ and AID-/- leukemia. 7 different AID+/+ samples comprise the wild type leukemia histogram (red lines). Shown are 6 different AID-/- leukemia samples in comparison (solid green overlay) and their isotype controls (dashed black line). D. Quantitative real-time RT-PCR of select differentially expressed genes. Data is shown as a percentage of murine Hprt gene expression. For each gene, 5 AID-/- samples and 5 AID+/+ samples from different mice were analyzed.

