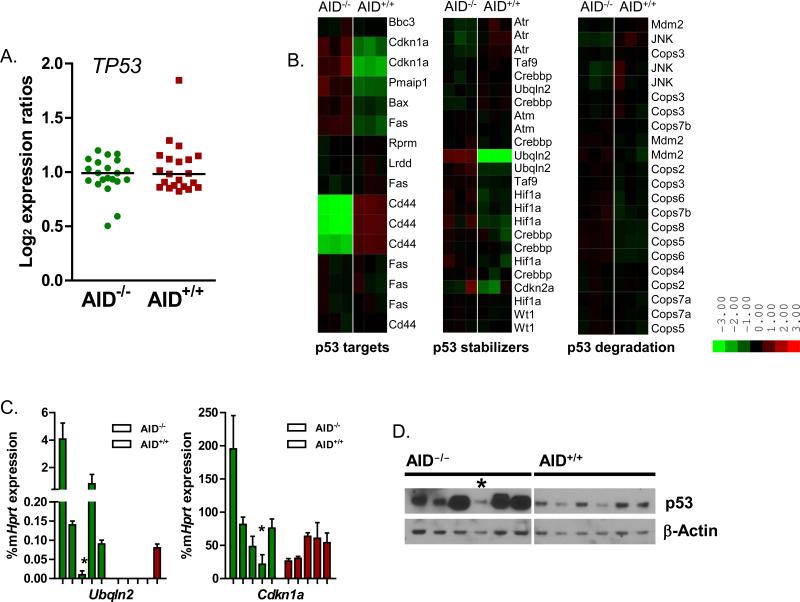
Figure 4. AID-/- leukemia cells fail to downregulate p53.
A. Shown is the log2 expression ratio for the seven different p53 probe sets in the mouse genome 430 2.0 array for each of the AID+/+ samples (N=3) and AID-/- samples (N=3). B. Heat map of downstream p53 targets, molecules involved in the p53 stabilization and p53 degradation. C. Confirmatory quantitative RT-PCR of Ubqln2 and Cdkn1a mRNA levels in AID-/- mice (percentage of Hprt mRNA levels). For each gene, 5 AID-/- samples and 5 AID+/+ samples from different mice were analyzed. D. Western blot analysis of p53 protein levels. Protein from 6 AID-/- leukemia samples and 6 AID+/+ leukemia samples was extracted and evaluated for p53 expression. The AID-/- outlier by PCA component analysis is designated by an asterisk.

