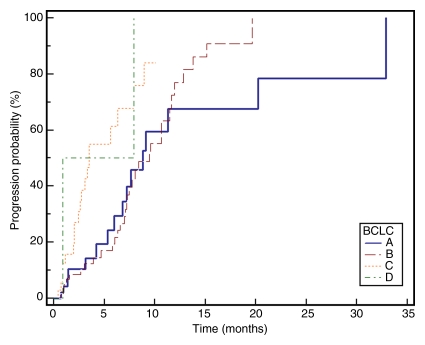
Figure 2e:
Kaplan-Meier curves demonstrate (a) TTP substratified by Child-Pugh class (CP) (P = .1351), (b) survival substratified by Child-Pugh class (P = .2927), (c) TTP substratified by UNOS stage (P = .0001), (d) survival substratified by UNOS stage (P < .0001). Kaplan-Meier curves show (e) TTP substratified by BCLC stage (P = .0009), and (f) survival substratified by BCLC stage (P < .0001).

