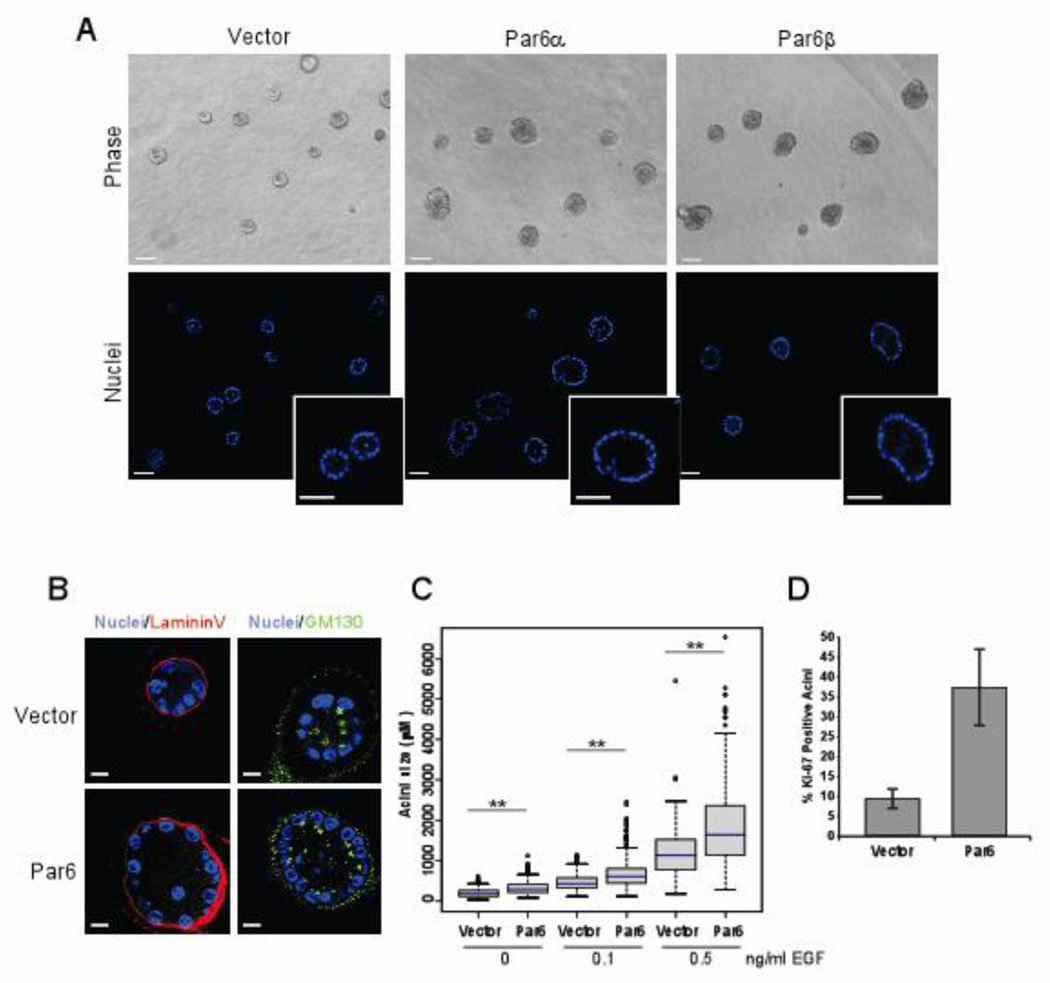
Figure 1. Overexpression of Par6 promotes proliferation without disrupting 3D acini morphogenesis.
(A) Phase contrast (top) and optical sections of acini stained with DAPI (bottom) images of Day 20 acini grown in 0.5 ng/ml EGF, insets show detail of hollow lumen. Scale bar represents 50 µm. (B) Immunofluorescence staining of Day 12 acini structures grown in 0.5 ng/ml EGF with the apical marker GM130 (green and basal marker Laminin V (Red) and co-stained with DAPI to monitor nuclei. Scale bar represents 10 µm. (C) Distribution of acini size (circumferential area) of Day 12 acini structures grown in 0, 0.1 and 0.5 ng/ml EGF. Area of each acini was measured using Zeiss Axiovision 4.5 software and plotted as box plots. The blue line represents the median value and the spread represents 1.5 times the inter-quartile range and outliers are shown as circles. Each condition represents approximately 800 acini structures from three dependent experiments. The P-value between Vector and Par6, for each EGF concentration was less than 0.0001 calculated by Mann-Whitney test. (D) Quantitation of Day 12 acini with at least one positive Ki-67 positive nuclei on Day 12 acini structures grown in 0.5ng/ml EGF Data is represented as percent Ki-67 positive structures +/− s.d. Each bar represents approximately 700 acini from three independent experiments.

