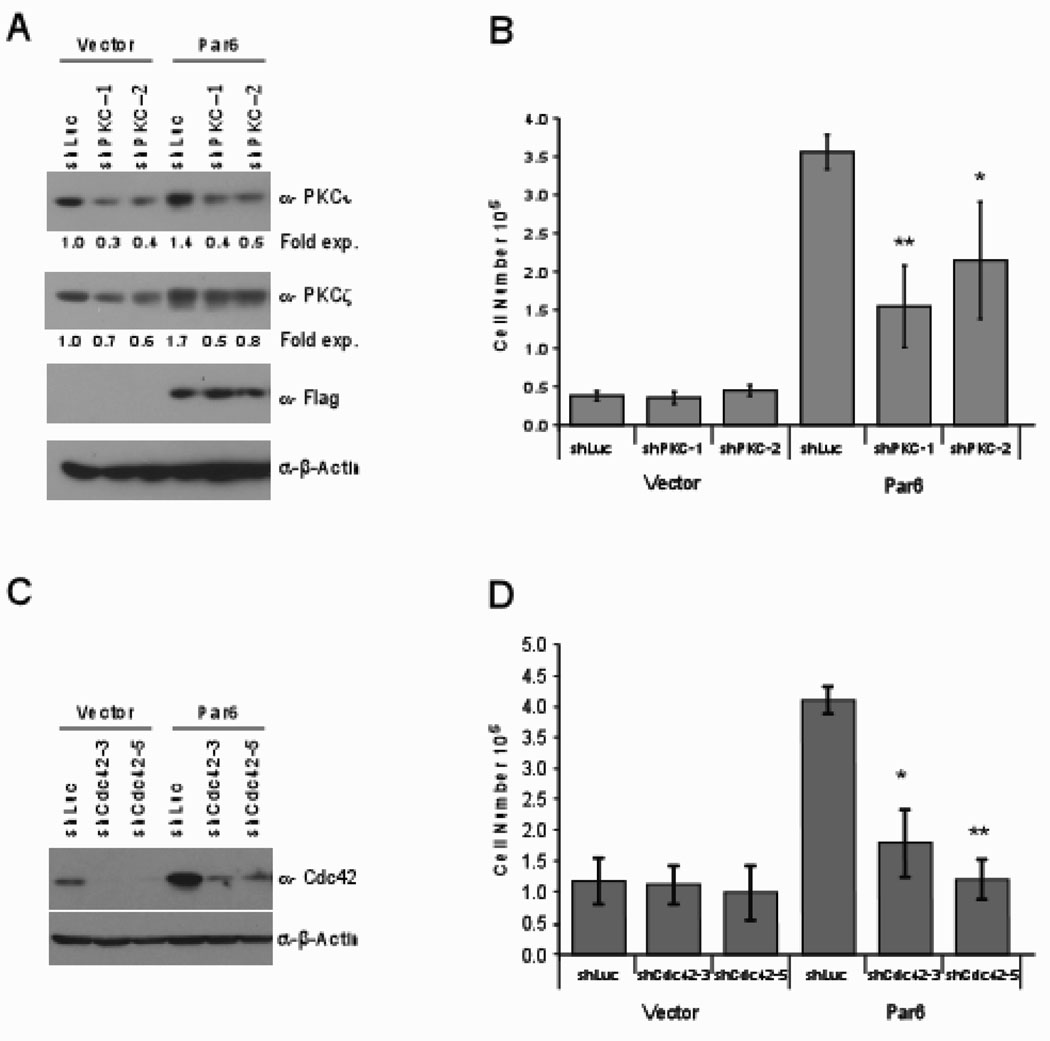
Figure 3. Par6 induced cell proliferation requires aPKC and Cdc4.
(A) Cell extracts from PKC short-hairpin infected MCF-10A cells immunobloted with indicated antibodies. The numbers below the bands refer to fold change in PKCι and PKCζ protein expression normalized to β-actin as determined by densometric analysis. (B) The indicated cells were grown in EGF free media for seven days and cell number was determined. Data are means +/− s.d. of quantitated cell numbers from three independent experiments. Student t-test were performed showing statistical significance between Par6wtshLuc and Par6wtshaPKC1 (P=0.004) or Par6wtshaPKC2 (P=0.04). (C) Cell extracts from Cdc42 short-hairpin infected MCF-10A cells immunobloted with indicated antibodies. (D) The indicated cells were grown in EGF free media for seven days and cell number was determined. Data are means +/− s.d. of quantitated cell numbers from three independent experiments. Student t-test were performed showing statistical significance between Par6wtshLuc and Par6wtshCdc42-3 (P=0.009) or Par6wtCdc42-5(P=0.0005).

