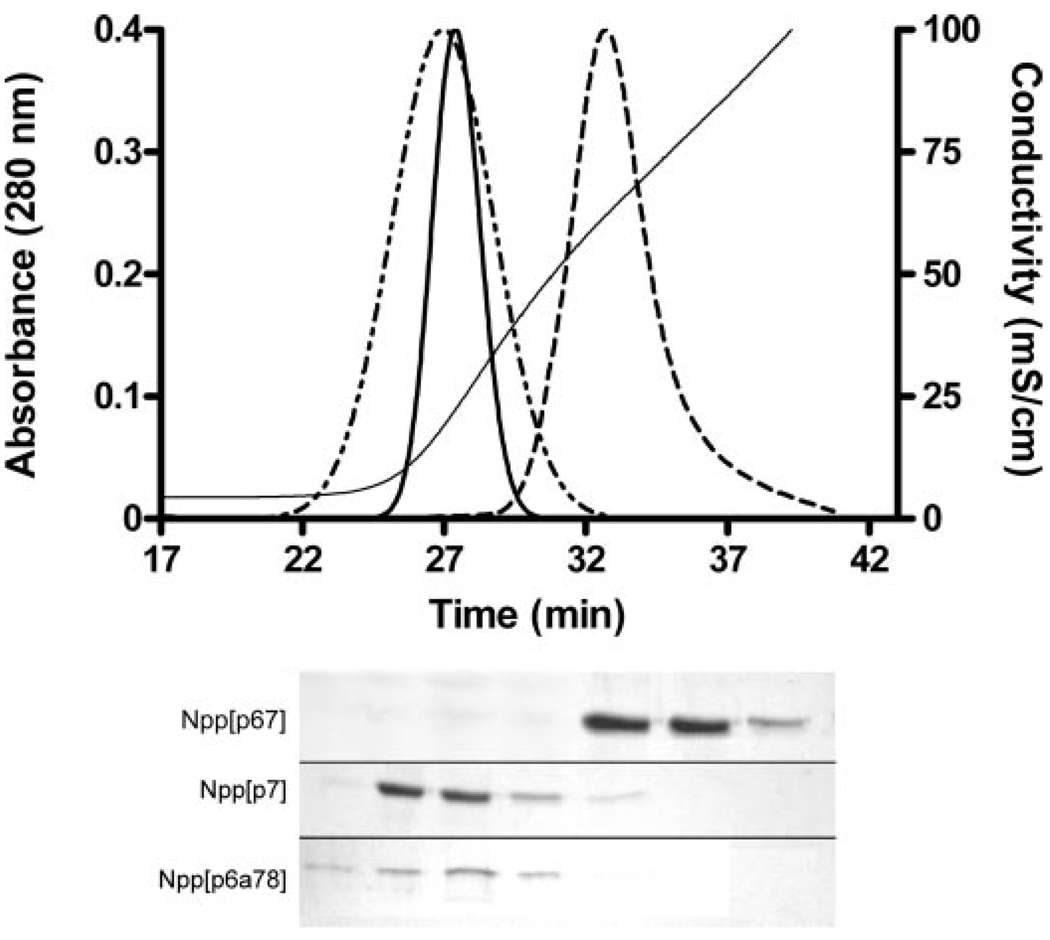
FIGURE 5. Heparin affinity chromatography comparing variable regions of collagen α1(XI).
Upper panel, elution profiles are shown for Npp[p6a78] (dotted and dashed line), Npp[p6b7] (dashed line), and Npp[p7] (solid bold line). Absorbance at 280 nm was normalized to the maximum height of the Npp[p6b7] peak. Conductivity during NaCl gradient elution of the protein is indicated on the right-hand axis (solid line). Lower panel, SDS-polyacrylamide gels of alternating 1-ml fractions collected during elution of the collagen α1(XI) splice variants. The position of the splice variants Npp[p6b7], Npp[p7], and Npp[p6a78] are indicated. The position of the bands in the lower panel are shown in relation to the chromatograms in the upper panel.

