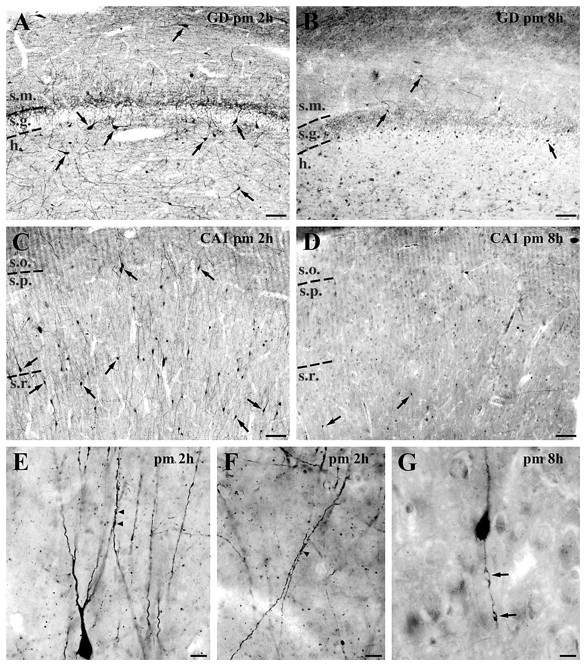
Figure 1.

Distribution and morphology of calretinin-positive cells in the human control hippocampus. (A) Dentate gyrus (GD), 2 h post-mortem (pm). Large cells in the hilus, horizontal cells in the molecular layer, as well as the small cells that are present in every layer are characteristic of well preserved control samples with short post-mortem delay. (B) Dentate gyrus, 8 h post-mortem. The majority of calretinin-immunoreactive cells disappear from the dentate gyrus. (C) CA1 region, 2 h post-mortem. Numerous immunoreactive cells with smooth dendrites can be seen in all layers of the CA1 subfield in control samples with short post-mortem delay. The mainly radially oriented cells are most frequent in the strata pyramidale (s.p.) and radiatum (s.r.). (D) CA1 region, 8 h post-mortem. In these samples hardly any calretinin-positive cells can be found in the CA1 region, and even those have a degenerating dendritic tree. (E, F and G) High-power light micrographs show the morphology of the calretinin-positive dendrites in the control CA1 region. Long, vertically oriented dendrites which are often juxtaposed and run together over short segments can be seen in control samples with short post-mortem delay (arrowheads, E and F). In control samples with long post-mortem delay, the dendrites show signs of degeneration, the enlarged beads are connected by thin segments (G). Scale bars: A–D = 100 µm; E–G = 20 µm; s.m. = stratum moleculare; s.g. = stratum granulosum; h = hilus; s.o. = stratum oriens.
