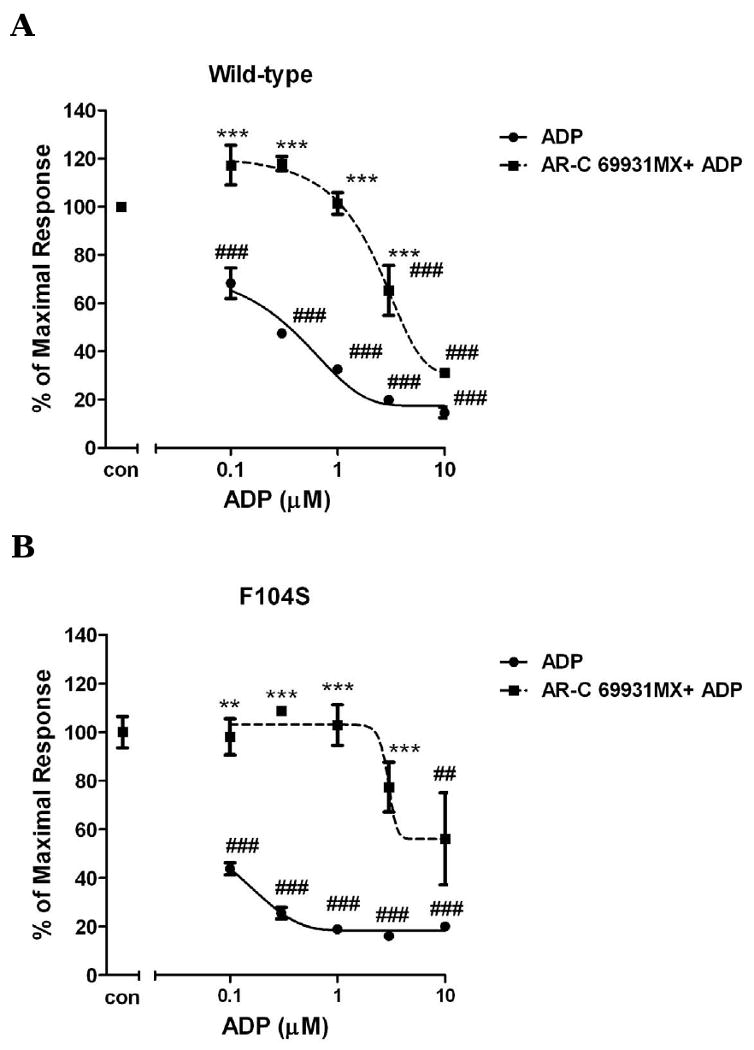
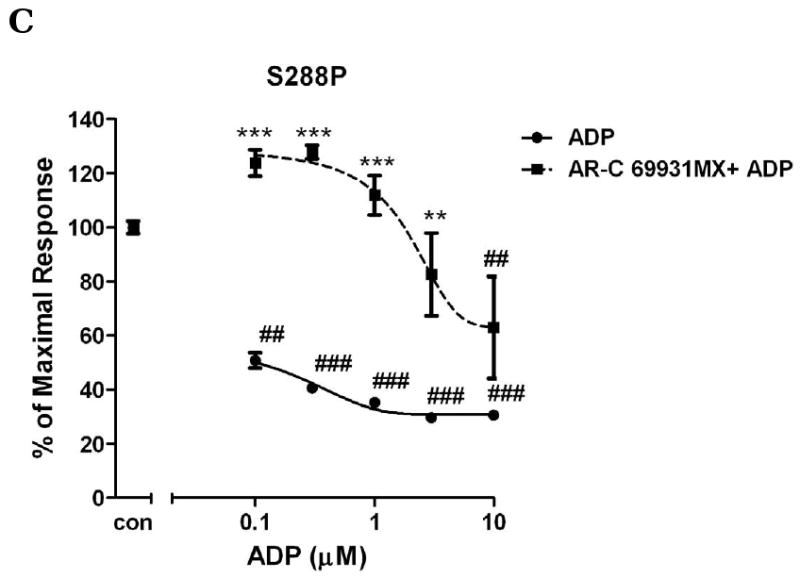
Fig. 5. The effect of submaximum AR-C69931MX on ADP-induced concentration-response curves of wild-type P2Y12 receptors (panel A) and mutants with mutated residues in TM3 (F104S) (panel B) and TM7 (S288P) (panel C) in antagonist analysis.


Inhibition of cAMP was measured after incubation of cells with different concentrations of ADP (0.1-30 μM) and stimulated for 5 min with or without 30 nM AR-C69931MX in presence of 20 μM forskolin. Data were normalized to the maximal response obtained in the absence of agonist and antagonist, which served as control (mean ± S.E.M., n=3). ## P<0.01, ### P<0.001, significant differences vs. respective control without agonist and antagonist. ** P<0.01, *** P<0.001, significant differences vs. respective values in the absence of the antagonist. (ANOVA followed by the Bonferroni post-test).
