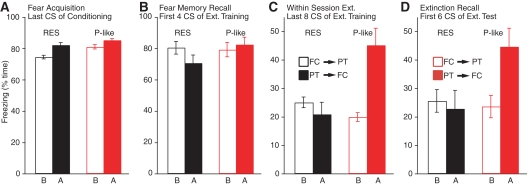
Figure 4.
Behavior of PTSD-like and resilient rats depending on timing of predatory threat. Bar graphs plot freezing levels in PTSD-like (red) and resilient (black) rats when fear conditioning was performed before (empty bars) vs. after (filled bars) predatory threat. Four phases are considered: (A) end of fear-conditioning session, (B) beginning of extinction training session, (C) end of extinction training session, and (D) beginning of extinction testing session.

