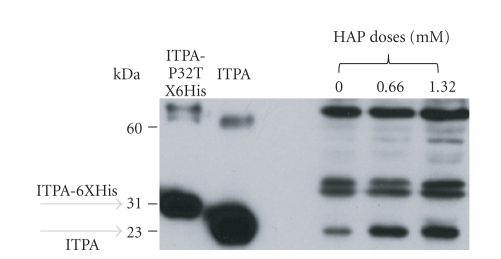
Figure 8.
HAP treatment leads to the increase of ITPA levels in HCT116 cell extracts. Western blots were performed as described in Section 2. Two controls are in the left part: first lane—His-tagged pure ITPA (30 kDA), second lane:—pure ITPA (23 kDa). Third, fourth, and fifth lane shows the levels of ITPA (23 kDA) in extract of untreated cells, and cells treated by 0.66 mM HAP and 1.32 mM HAP. To estimate the induction of ITPA, we measured the ratio of the intensity of the band corresponding to monomeric ITPA to nonspecific bands. Estimated by this method, the induction relative to the control was 2.2 times at 0.66 mM and 2.6 times at 1.32 mM.

