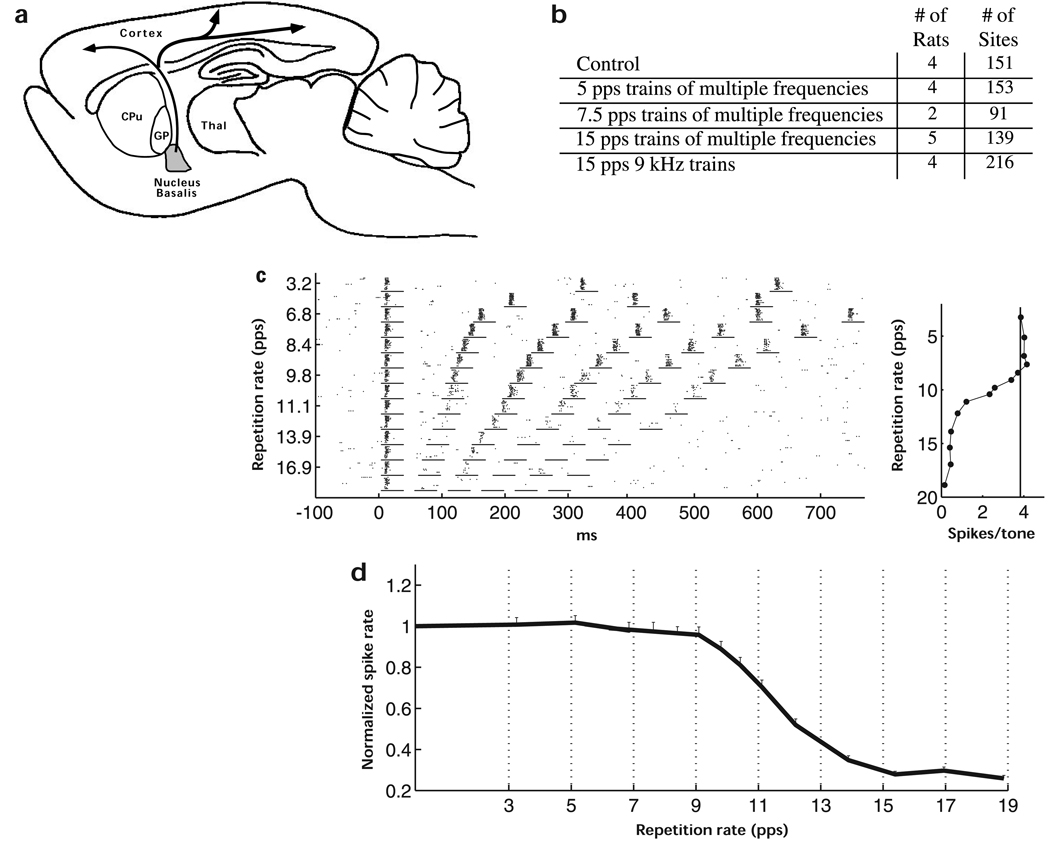
Fig. 1.
Response of rat auditory cortex neurons to repeated stimuli. (a) Schematic diagram of the projection of nucleus basalis to the neocortex. (b) Number of rats and penetrations for each experimental condition. (c) Dot rasters and repetition-rate transfer function (RRTF) of primary auditory cortex (A1) neurons from a naïve (control) rat. Each dot represents a single action potential. The short horizontal lines indicate the spike-collection windows that were used to generate the RRTF. The RRTF quantifies the generally low-pass nature of the responses of A1 cortical neurons to these pulsed stimuli in the rat. The solid vertical line in the RRTF shows the average number of spikes evoked by the first tone in the train. (d) Mean normalized RRTF for all penetrations recorded from normal (control) rats. Error bars indicate standard errors.

