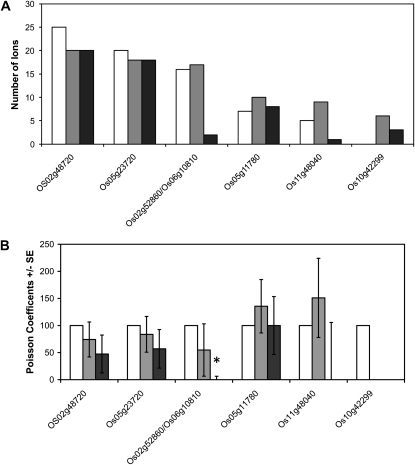
Figure 6.
The relative abundance of members of the MC family in rice. Samples were prepared from carbonate-extracted mitochondrial membranes isolated from embryos of dry seeds (white bars), 48-h-imbibed anaerobic-treated seeds (gray bars), and 48-h-imbibed aerobic-treated seeds (black bars). A, Average spectral counts for each OsMC member. B, Analysis of spectral counts by Poisson regression analysis displayed as relative Poisson coefficients ± se (n = 3). The statistical analysis results can be seen in Supplemental Table S1. * P < 0.05.

