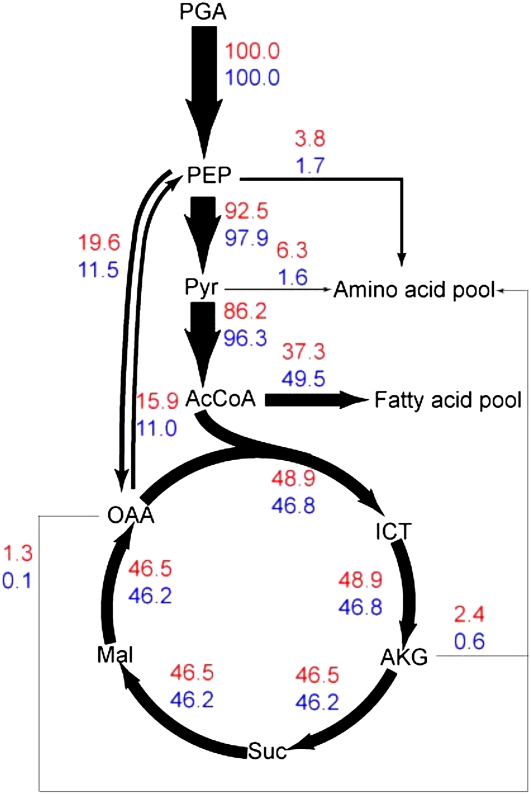
Figure 4.
Flux distribution at several branch points adjacent to fatty acid synthesis. The width of arrows is proportional to the flux of carbon through a particular step calculated from the flux estimates. The top and bottom numbers represent relative flux during nitrogen-sufficient and nitrogen-limited cultivation, respectively. [See online article for color version of this figure.]

