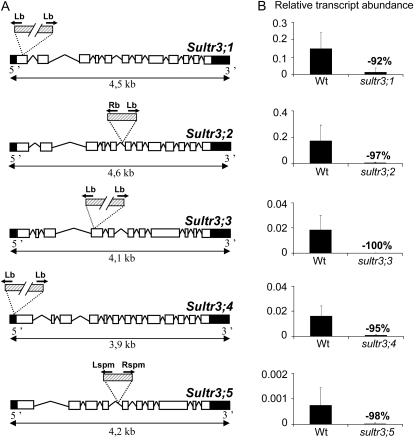
Figure 2.
T-DNA insertion sites and residual expression from the disrupted SULTR3 genes. A, Structure of the SULTR3 genes with the insertion sites for the mutant lines SALK-023190 (sultr3;1), SALK-023980 (sultr3;2), SALK-031340 (sultr3;3), SALK-100362 (sultr3;4), and NASC-N112372 (sultr3;5). The exons are indicated by white boxes, untranslated regions by black boxes, and T-DNA by dashed boxes. PCR was performed by using specific primers for each gene binding upstream and downstream of the predicted T-DNA insertion and primers binding in the border regions of the corresponding T-DNA (black arrows). Detailed information about primers and sequences is available in Supplemental Figure S2. B, Residual expression level of the disrupted SULTR3 genes using the gene-specific primers listed in Supplemental Table S1 from RNA extracted from developing siliques (for the sultr3;1, sultr3;4, and sultr3;5 mutants versus the wild type [Wt]), flowers (for the sultr3;2 mutant versus the wild type), or leaves (for the sultr3;3 mutant versus the wild type). Bars represent means ± sd of three biological replicates. Lb and Lspm, Left border primers of the T-DNA from SALK and NASC lines, respectively; Rb and Rspm, right border primers of the T-DNA from SALK and NASC lines, respectively.

