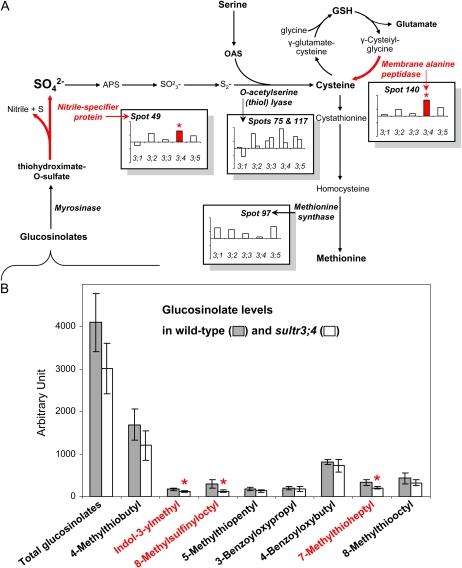
Figure 7.
Suggested compensation mechanisms in sultr3;4 mutant seeds. A, Sulfate assimilation pathways and the regulations in mutant seeds reflected by proteomic analyses. The bars indicate protein abundance variation in mature seeds (log2 volume ratios in mutant seeds versus wild-type seeds). APS, Adenosine-5′-phosphosulfate; GSH, glutathione; OAS, O-acetylserine. B, Glucosinolate levels determined in wild-type and sultr3;4 mutant seeds. The bars represent means ± sd of four biological replicates. Asterisks and red color indicate significant variations (Student’s t test, P < 0.05). See Figure 4C for Cys and GSH levels in mature seeds of the sultr3 mutants. [See online article for color version of this figure.]

