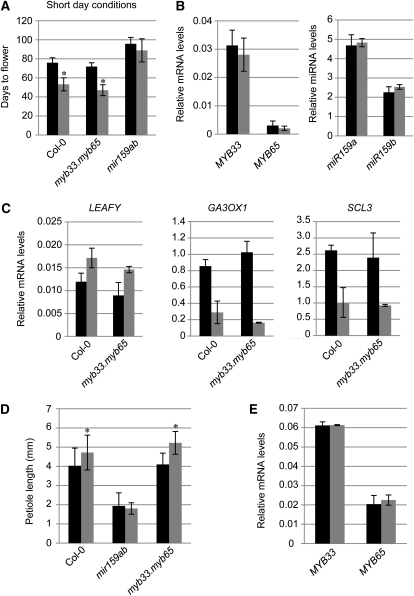
Figure 2.
GA response of the miR159-GAMYB pathway in vegetative tissues. A, Effect of GA and control (ethanol) treatments on the flowering time of wild-type Columbia-0 (Col-0) and mutant plants under short-day conditions. B, mRNA levels of MYB33 and MYB65 and the levels of mature miR159a and miR159b in wild-type SARs. C, LFY, GA3OX1, and SCL3 mRNA levels in wild-type Columbia-0 and myb33.myb65 SARs grown under short-day conditions. D, Petiole length of 23-d-old third leaves of plants grown under long-day conditions. E, mRNA levels of MYB33 and MYB65 in 32-d-old wild-type rosettes grown under short-day conditions. Black bars represent control (ethanol-treated) plants, and gray bars represent GA-treated plants. Error bars represent sd, and asterisks mark statistically significant changes.

