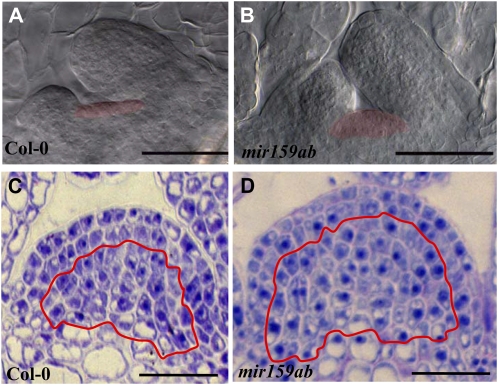
Figure 8.
mir159ab displays a hypertrophic SAM. A and B, Differential interference contrast microscopy of cleared tissue from 4-d-old wild-type Columbia-0 (Col-0; A) and mir159ab (B) seedlings. SAM regions have been shaded. C and D, Median longitudinal cross-sections of 14-d-old wild-type (C) and mir159ab (D) SAMs. The red line is delimiting the L3 and subtending meristematic region. Bars = 50 μm.

