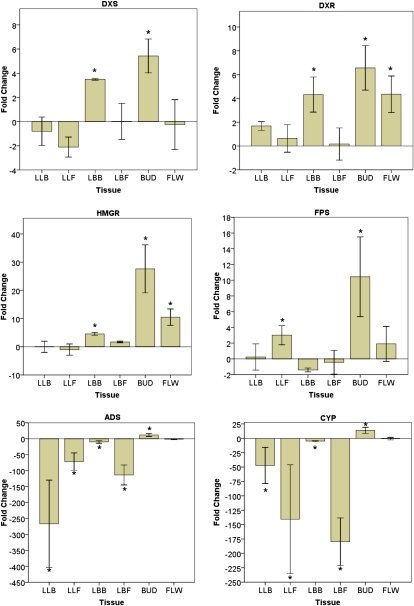
Figure 4.
Responses of artemisinic metabolite-specific genes (DXS, DXR, HMGR, FPS, ADS, and CYP71AV1) to budding and flowering. Values displayed are mean fold change as calculated by the 2−ΔΔCT method ± sd (n = 5). * P < 0.05, relative to vegetative plants. [See online article for color version of this figure.]

