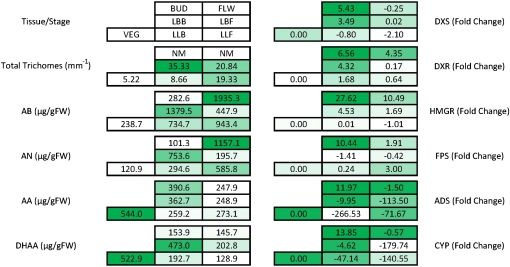
Figure 7.
Summation of trichome populations, transcript levels, and artemisinic metabolites throughout the development of A. annua from vegetative growth through full flowering. Numbers within each box are average values obtained for each leaf type analyzed for the indicated factor. Shading of the boxes indicates the relative level of response. Fold change is against VEG leaves. FW, Fresh weight. [See online article for color version of this figure.]

