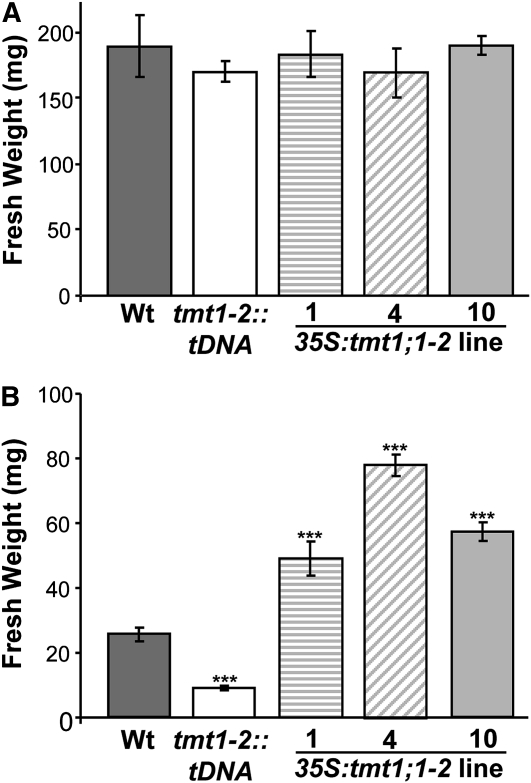
Figure 3.
Fresh weight of wild-type (Wt) and TMT1 mutant Arabidopsis plants grown in liquid culture. A, Plants were grown for 7 d in liquid culture medium. B, Plants were grown for 7 d in liquid culture medium plus 5% Glc. Dark gray bars represent wild-type samples, white bars represent tmt1-2::tDNA, striped bars represent 35S:tmt1;1-2 line 1, diagonal striped bars represent line 4, and light gray bars represent line 10. Asterisks above the bars report the results of a significance test (Student’s t test) for differences between the TMT mutants and the wild type: *** P < 0.005. Each data point represents the mean of three independent biological experiments ± se.

